Table of Contents
Background
For this project, we decided to create a website that gives estimates on home prices and other metrics, with predictions made with a Random Forest Generator. The next page is a map displaying all the homes within the search criteria as an interactive way to observe the data.
Methodology
Data Set
The data set being used is “USA Real Estate Dataset” - (Sakib, 2023) on Kaggle.com.
Data collected from:
https://www.realtor.com - (News Corp Subsidiary Move, Inc.)
Home Price Predictor
The Home Price Predictor utilizes a Random Forest Generator, to create estimate values. It’ll take 85% of the data set to train itself on, and use the remaining 15% to test itself to ensure accuracy in the algorithm. Once the program trains and tests itself, it’ll run through each search criteria, going through different branches to predict an estimated average for all the filters entered.
Map
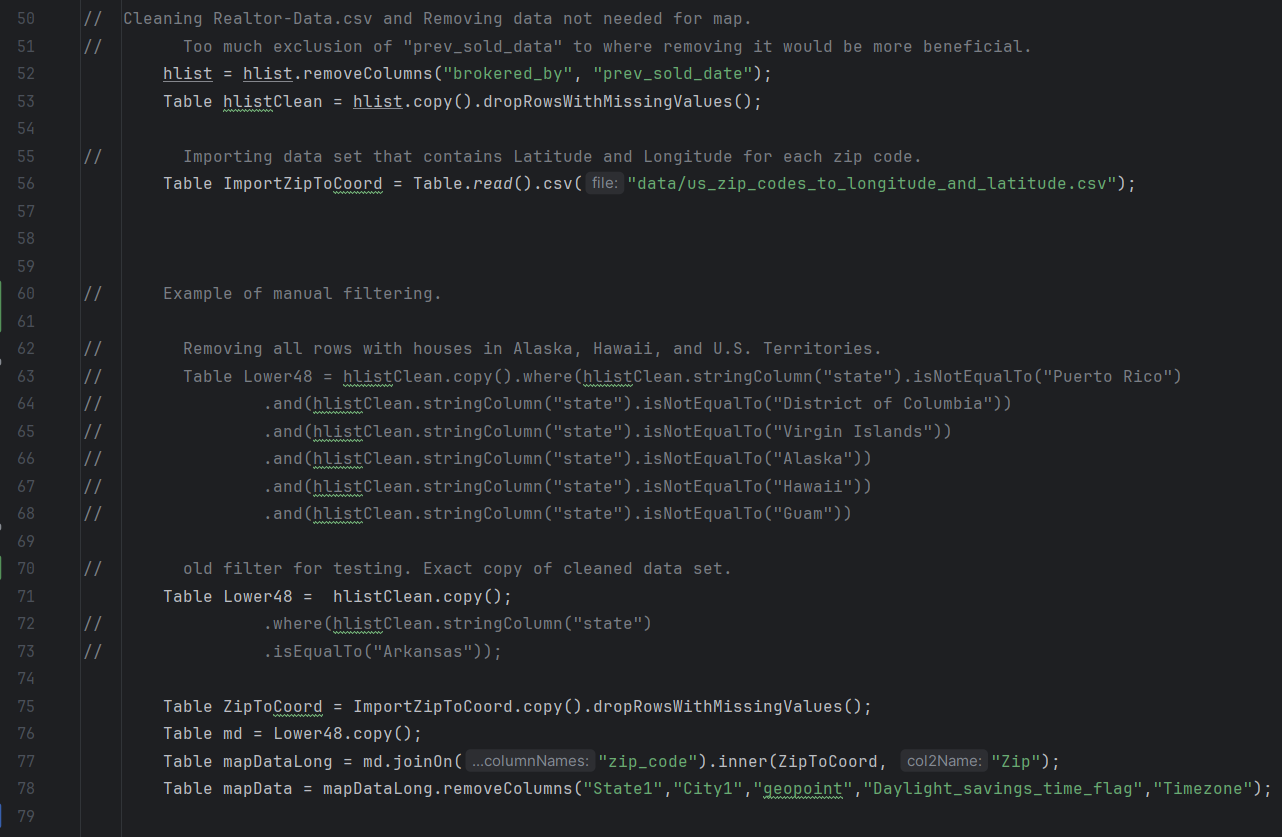
The map function takes the data set and projects the markers onto the map depending upon the user inputs within the filter box. Since the original data set with all the home price metrics doesn’t include any coordinates. Therefore, another data set containing zip codes along with their longitude and latitudes is also needed and joined with the original data set. Finally, the new table will be put on the map utilizing a for loop to run through the table to create the markers. This implementations has been achieved with previous versions of the program. However, when the filtering functions were implemented, null errors occurred for the state filter function. For the filters, it’s fairly similar in aspects to the home price predictor page, with a few changes described in the code section. The only required filter would be the
Code
Home Prediction Page
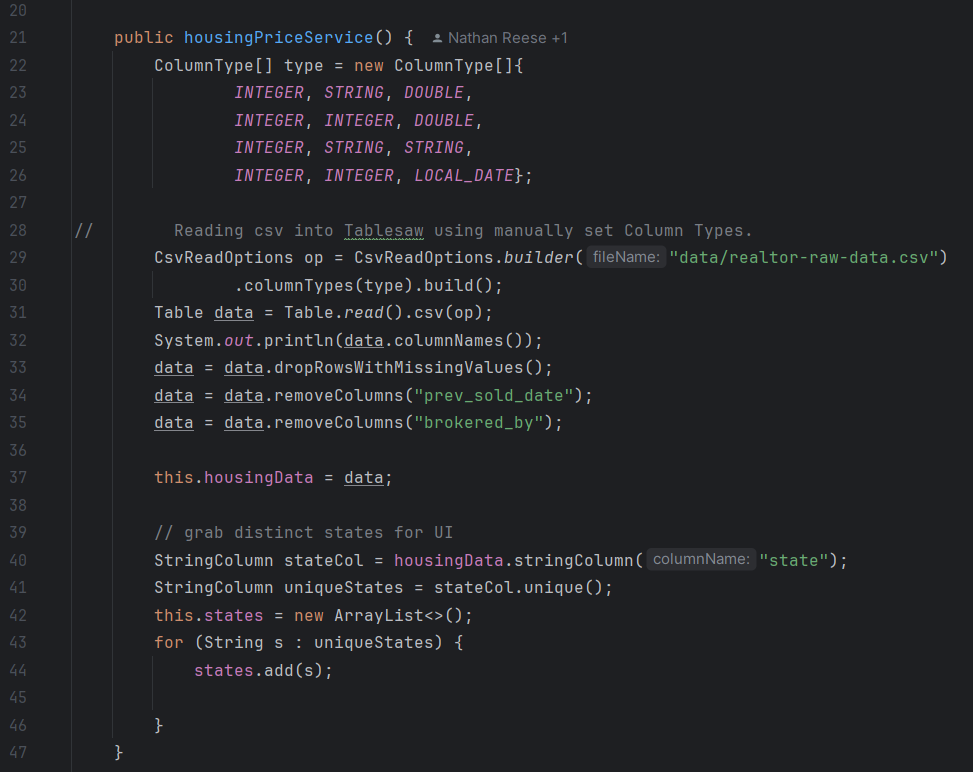
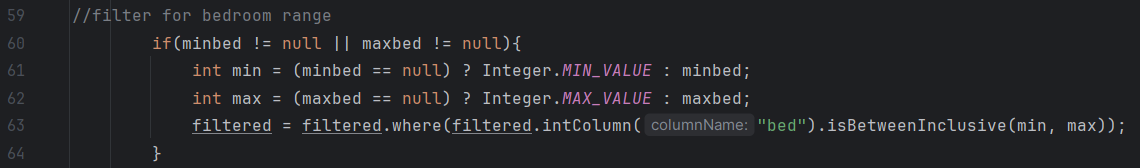
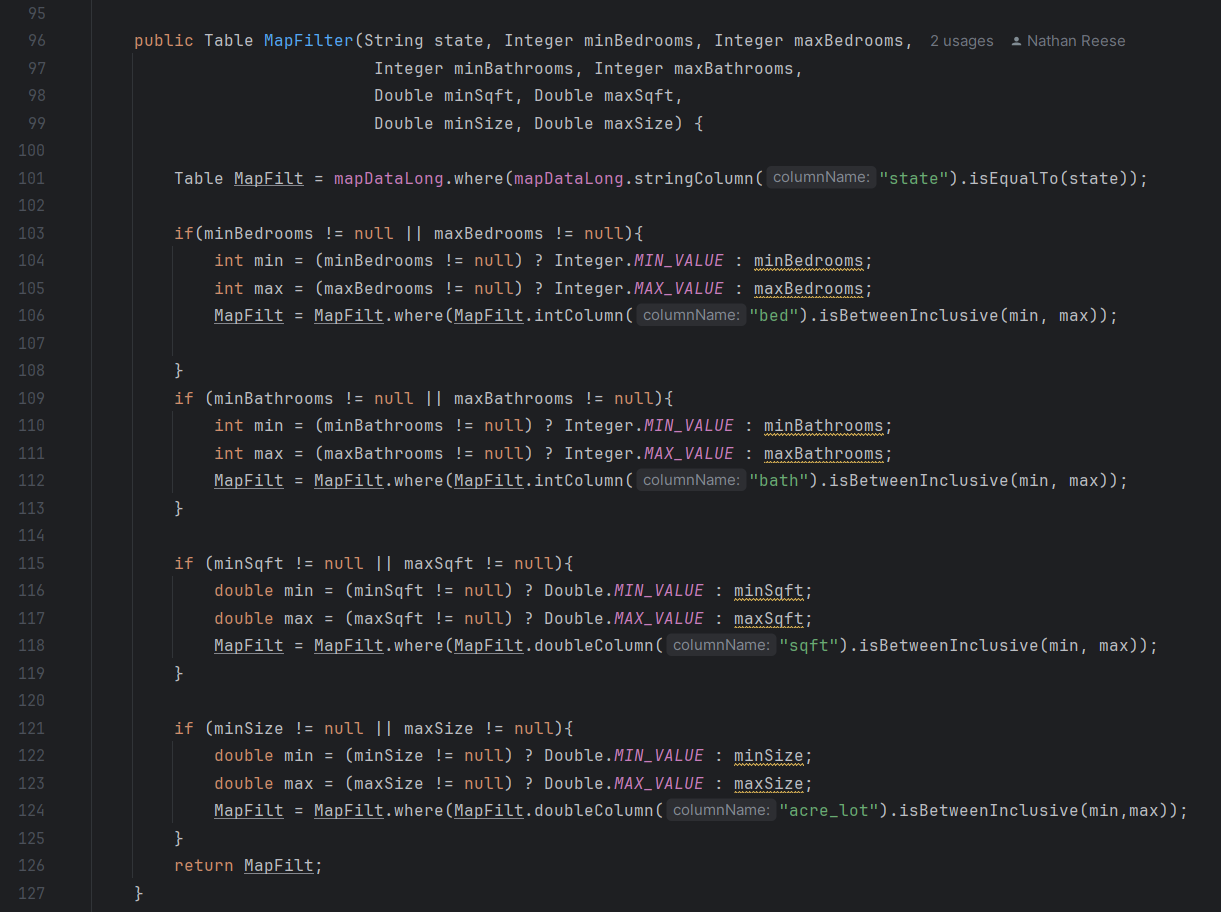
For the Home Price Predictor, the filtering was done with tablesaw in it’s own page, then called into the page view. Here’s what the housingPriceService class file looks like:
The Images are referenced by the text below each image.
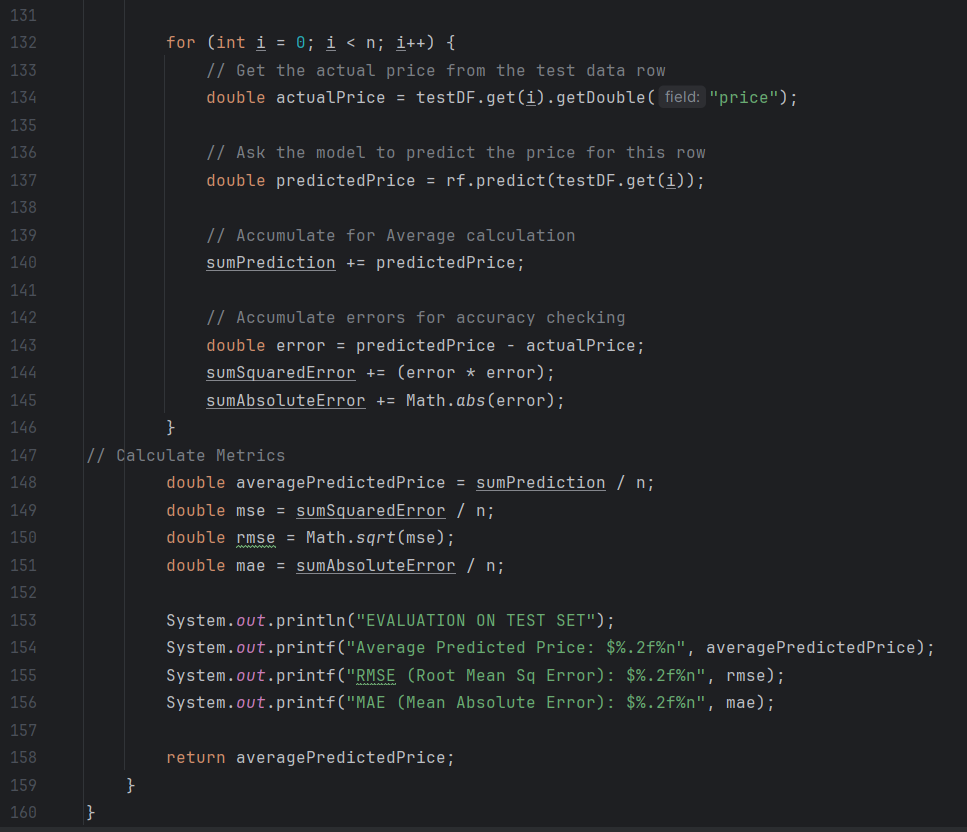
 In the next method, the program uses the smile java plugin to create a Random Forest Generator with the filtered table. The sampleSplit function creates the 85/15 train/test split and imports each segment into their own data frame.
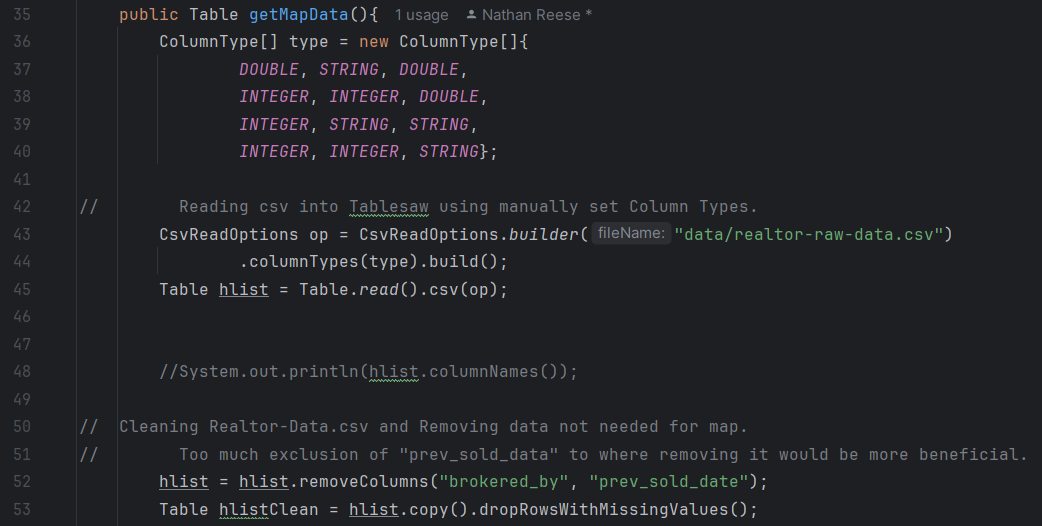
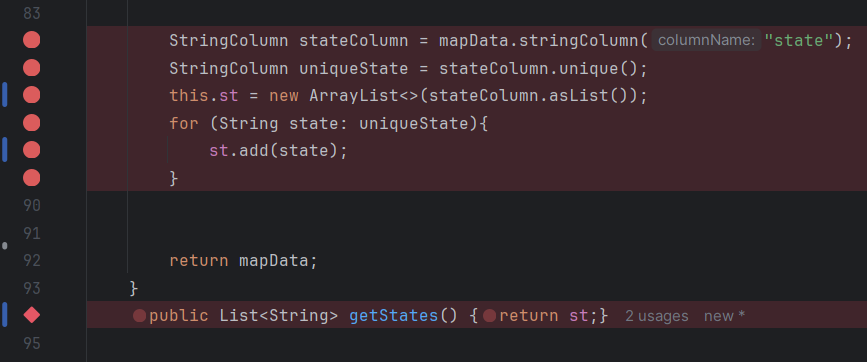
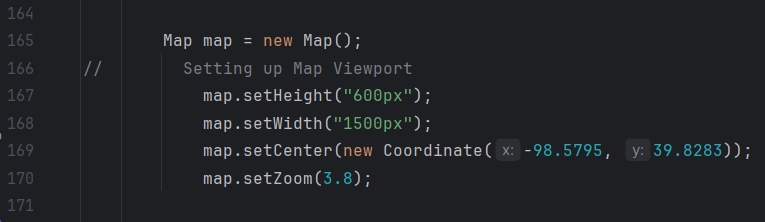
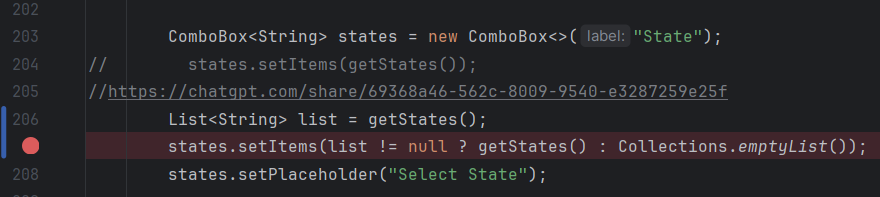
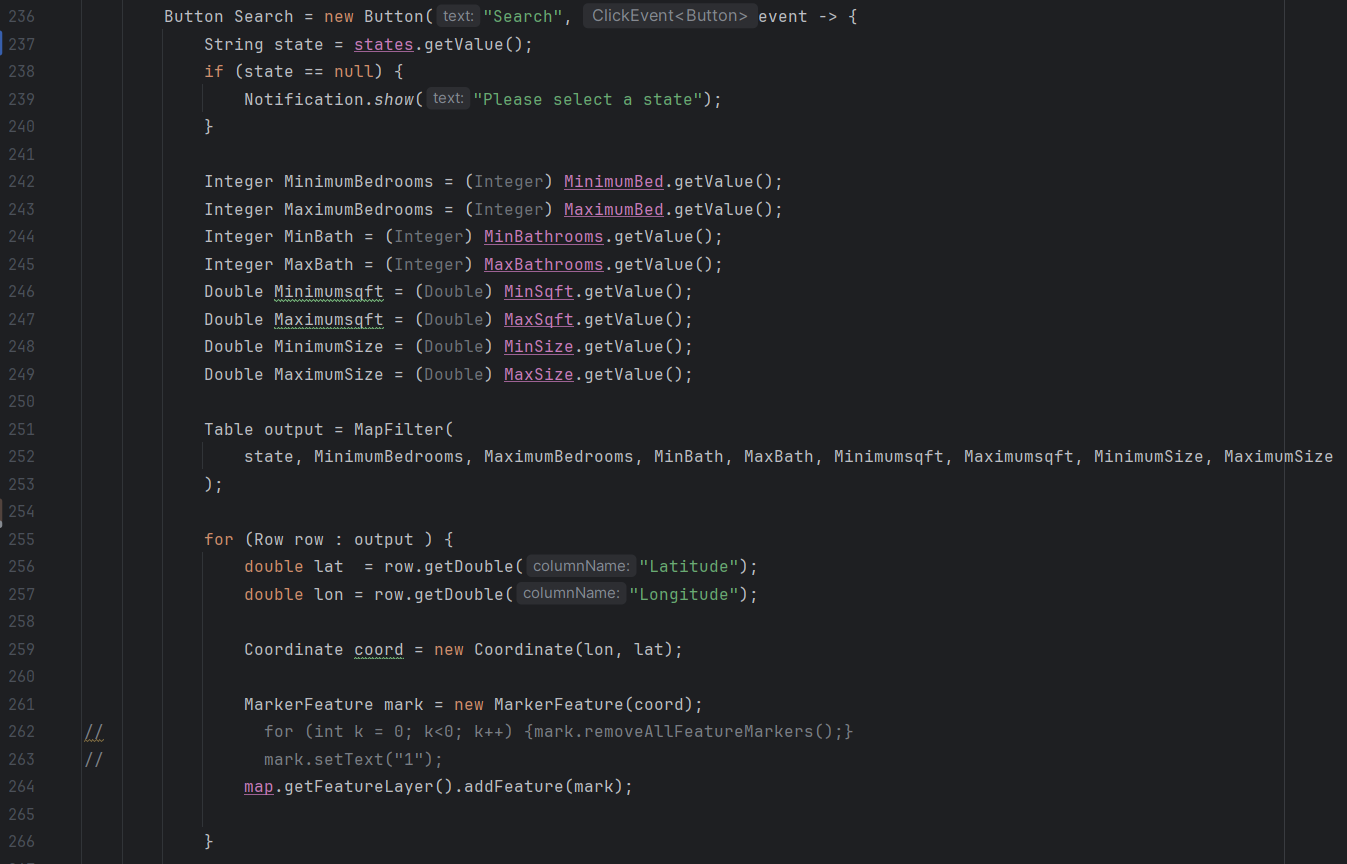
Map Display Page
For the map display page, all of the table import, filtering, and view port codes is done on the page2view class. While this looks less clean, it’s a lot easier for accessing everything. There’s an error that should be noted though, as it’s unable to display markers on the map. Previous versions of the program are able to load all the points into the view port; however, with implementation of filters creates an issue where the state filter is unable to load a list of unique states. Since filters are dependent on the state filter, this prevents the program from loading points on the map. The code is all there and should work if a list of states populated the ArrayList.
The Images are referenced by the text below each image.
User Interface Guide
Home Price Predictor Guide
When opening the website, the user is greeted with the Home Price Predictor.
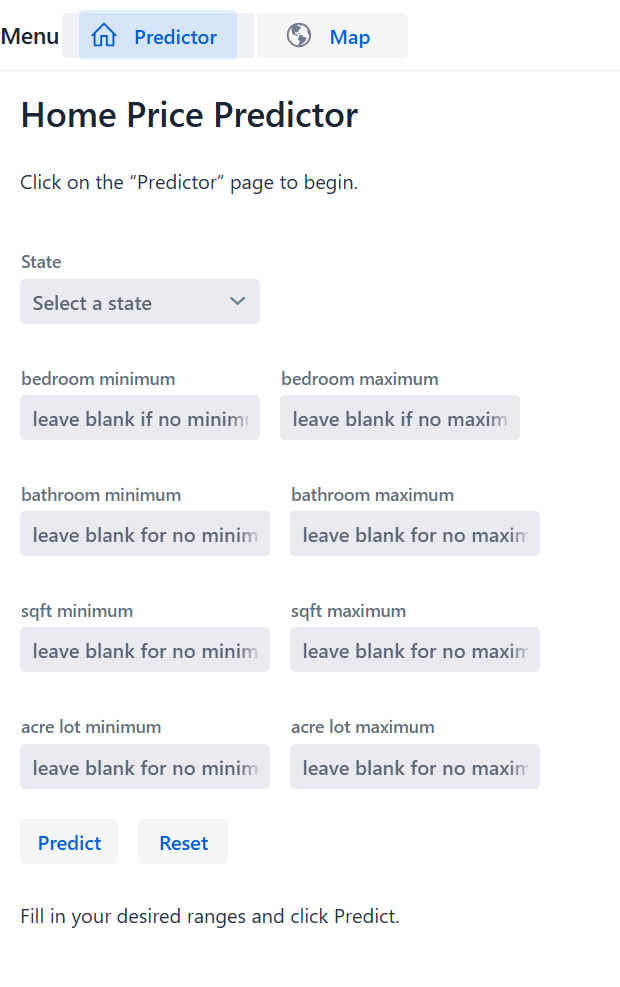
1. After starting up the program,
the user will be greeted by the price predictor page.
2. From here they can filter through any of the
filter boxes or leave blank if there’s no desire to
filter through, but a state is required.
3. There are five different filter criteria that a user
can filter, by state, bedroom, bathroom,
home square footage, and acre size.
4. Excluding the state filter, each filter criteria have
two input boxes. The box on the left sets the input
as the lower bound of the filter (minimum), and the
box on the right sets the input as the upper bound
(maximum).
5. Once all the desired filters are inputted into their
respective box. After clicking the predict button,
the program runs the inputs through the model
and returns the predicted value of the home.
6. To reset the filter boxes, the reset button will clear
all input values back to their default setting,
where it can be reused.
Map Guide
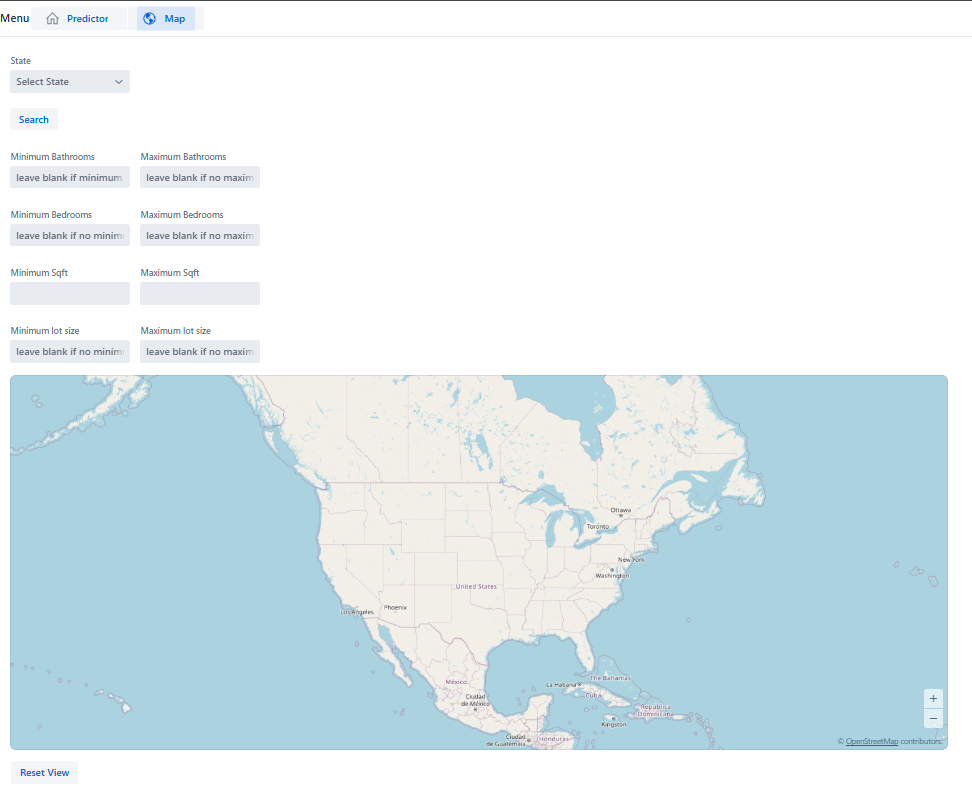
1. The user can zoom in and out as needed using the scroll wheel or touch pad of
their computer.
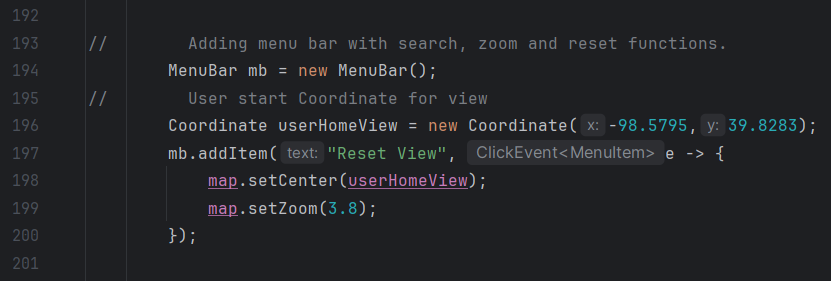
2. If the user wants to reset the viewing panel to the original settings, they can click
the reset option, and it will revert to the original zoom over the center point.
3. User will fill in necessary search criteria. They must enter a state to not overload
the program. However, whether the non-state related search boxes have
values in them is up to the user.
4. With all the different search criteria present, the user should enter the lower
bounds (minimum) into the left box and enter the upper bounds (maximum) into
the right box. Each filter box minus the state (not pictured) can be left blank and
will remain unfiltered from the map.
5. After entering all desired filters, clicking the search button will display the points
on the map of all the houses in all cities of the desired state.
6. Clicking the reset button at the bottom will reset the view port back to the original
settings.
The user should be able to view any city of interest within the United States. The data
points have the ability to populate the map and have done so in previous versions.
Reflection and Alternate Ideas
Overall this project was fun, and added a lot of thinking behind implementation. I do wish I had more time to complete the map, since it’s fairly close to working. Originally, we were going to use the High Charts overlay for the map. High Charts would use a Geojson file to populate the map, and import as a layer over the Vaadin map. We ran into a few issues where High Charts had to be scrapped from the project.
High Charts is a Javascript based plug in. It would require using an online converter to change the Java code into Javascript, then more work connecting it back to Vaadin.
More connection issues with our JDK and SDK. Currently, this class uses Liberica 17 but for high charts, it would require using Oracle Graalvm. Oracle would allow for better implementation of Javascript within the java native program. Overall though, it would result in more issues down the line since neither of us have much experience with that specific JDK.
Using Vaadin map ended up making more sense due to time constraints. The last obstacle for the map was the filtering feature. After getting a working map, the filters were implemented. One method explored was adding the tablesaw data into a Vaadin grid that’s kept invisible. That way the filtering is much more native with Vaadin functions. The filters would filter the grid behind the scenes, and port that into the map in real time. After some experimentation, the filters were kept within Tablesaw due to concerns with load time.